Getting started
A tour of the window
The parts of the mxds window, what each one is for, and how to open it from the keyboard.
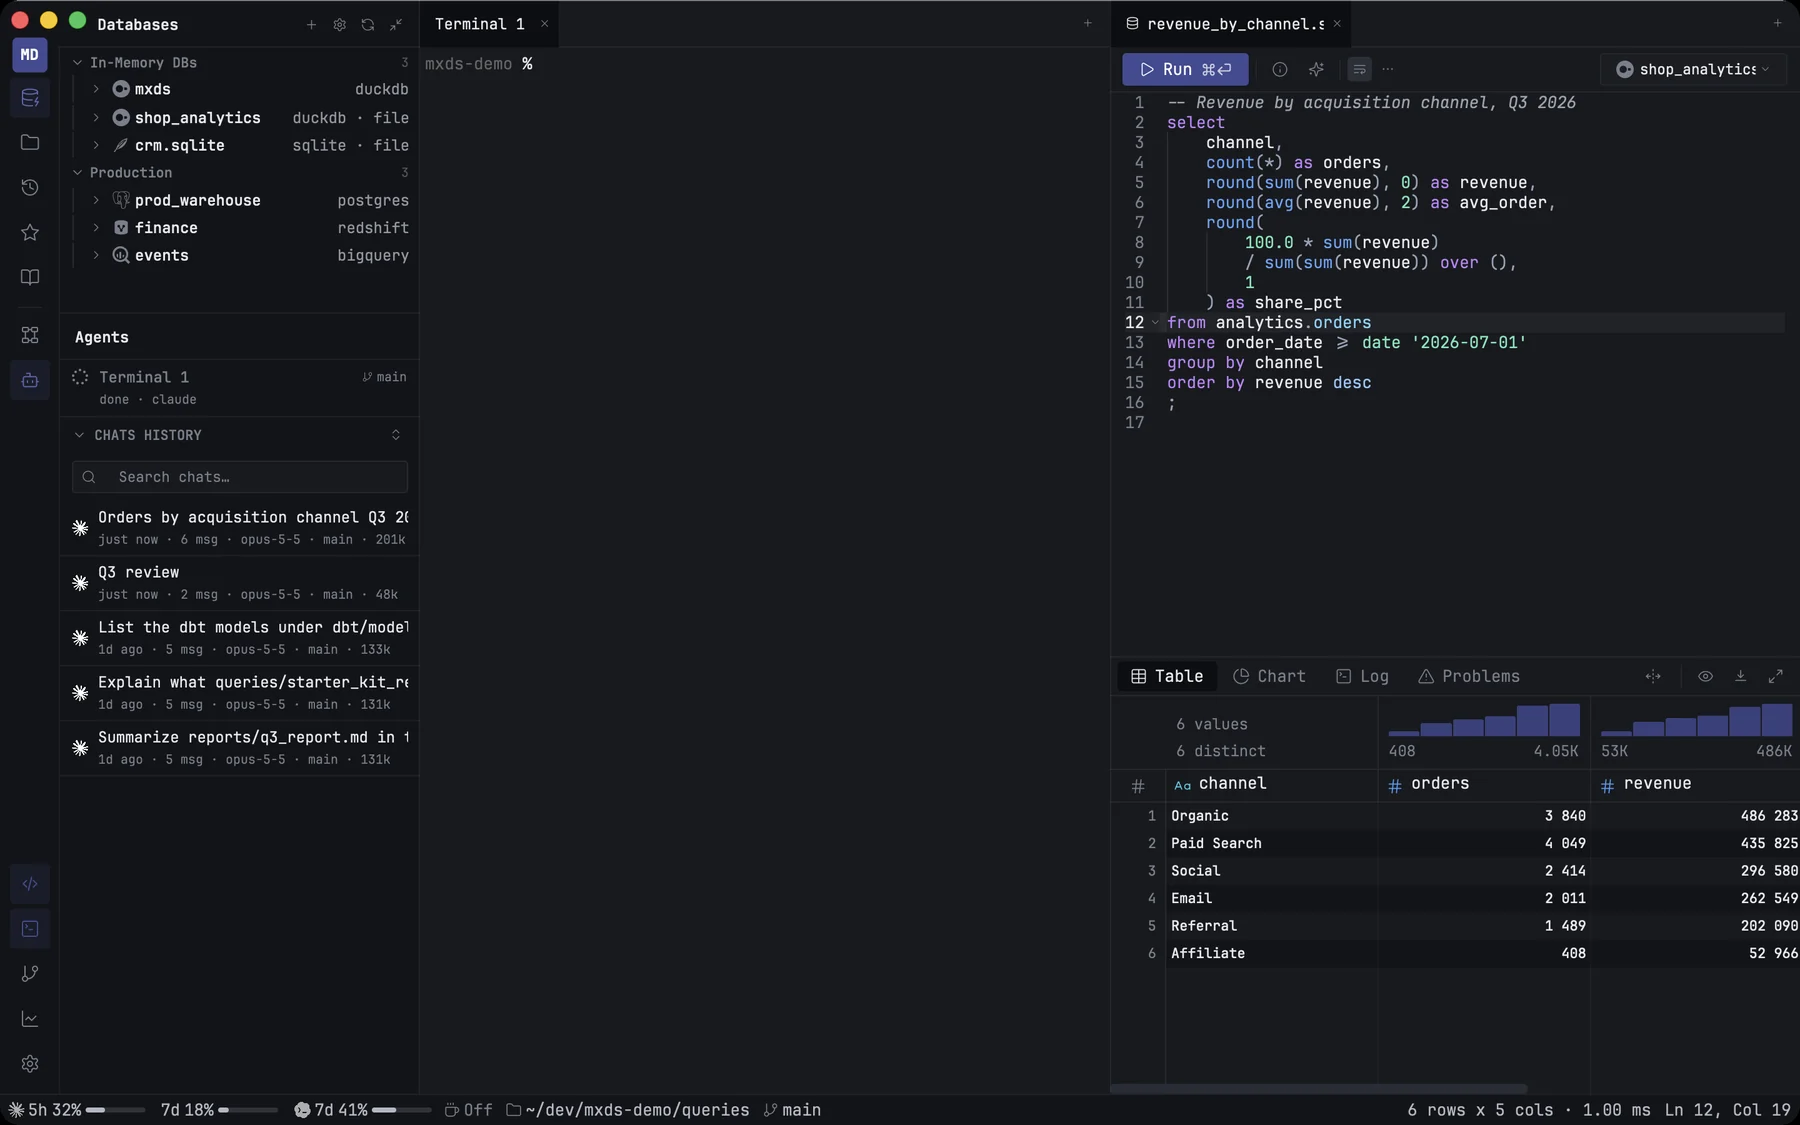
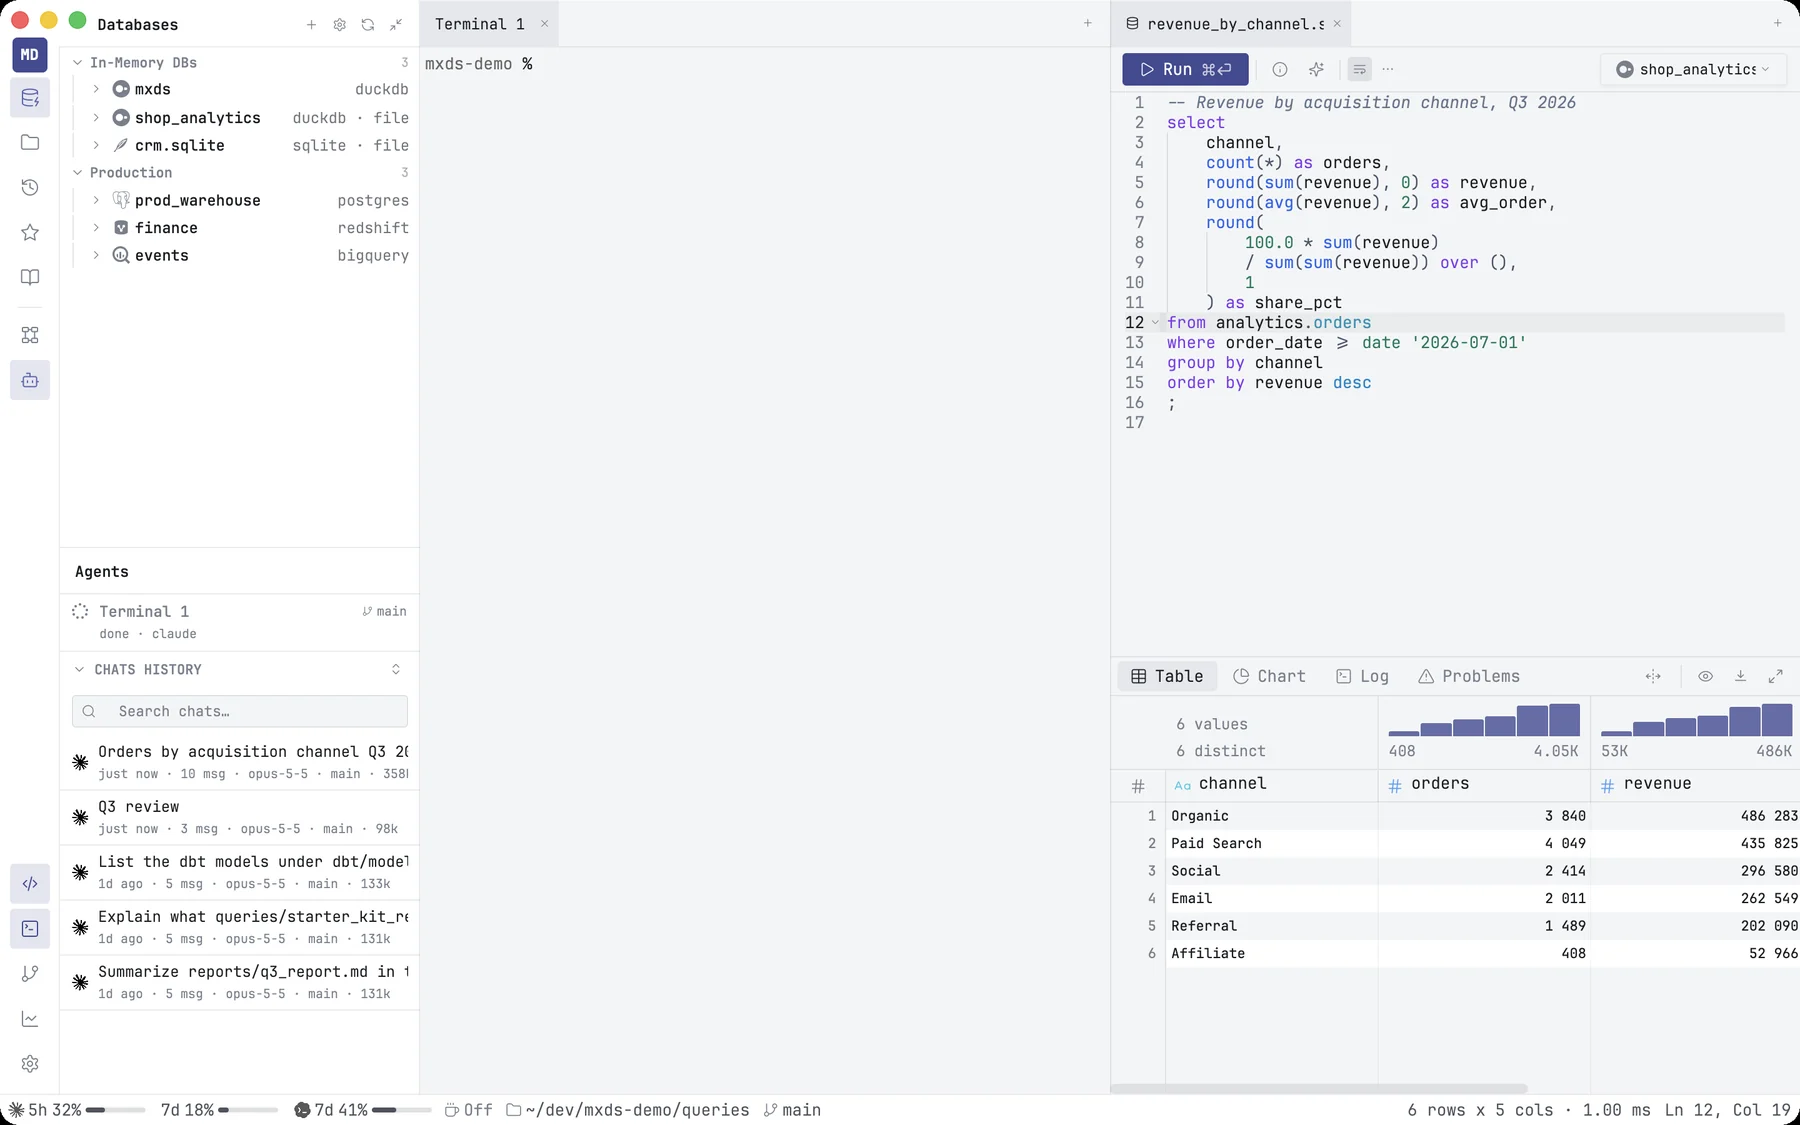
mxds keeps everything for one project in one window: your databases on the left, a terminal for your agents, the editor and its results on the right, and a status bar along the bottom.
The rail
The narrow column on the far left switches what the sidebar shows. Hover an icon to see its name and shortcut.
| Icon | Opens | Shortcut |
|---|---|---|
| Databases | your connections, their schemas and tables | ⌘B |
| Files | the project folder | ⌘E |
| History | every query you and your agents ran | ⌘Y |
| Starred | tables, queries and files you starred | |
| Recall | the project's knowledge base | ⌘⇧K |
| Schema | docs for the table you are looking at | |
| Agents | agents running in the terminal, and past chats |
The sidebar has two sections, top and bottom, separated by a line in the rail. Drag an icon across the line to move its panel to the other section. Clicking the icon of a panel that is already open collapses that section. ⌘\ hides or shows the whole sidebar.
The square at the top of the rail carries the project's initials; click it for the Welcome screen. At the bottom are toggles for the editor (⌘⇧E), the terminal (⌃`), the git view (⌘G) and the usage dashboard (⌘⇧I), and the Settings button (⌘,).
The terminal
The terminal is where your agents work: Claude Code, Codex, opencode or any other command-line tool. Open more tabs with ⌘T while the terminal has focus, split with ⌘D (right) or ⌘⇧D (down), and move between splits with ⌘⌥ and an arrow. Your shells keep running when you quit mxds and are there again when you open it.
The editor
Each file opens in a tab of the kind its extension calls for:
- SQL — a query tab with Run, Explain and Format, and the connection it runs on at the right of the toolbar. New scratch tabs are called
query_1.sql,query_2.sqland so on, and are saved in the project for you. - Markdown — edit, preview, or both side by side. In the preview you can comment on any passage and send the notes to the agent in the terminal.
- Notebook — any
.ipynbfile, on a real Jupyter kernel. - dbt model — a model of the open dbt project, with Preview and dbt build in place of Run.
Results
Under the editor are the results of the active tab, in one row of tabs:
| Tab | Shows |
|---|---|
| Table | the result, with a summary above every column |
| Chart | a chart of the result |
| Log | what happened: statements that change data, dbt runs, errors |
| Compiled | the SQL a dbt model compiled to (dbt tabs only) |
| Lineage | the dbt project's graph (dbt tabs only) |
| Problems | lint warnings and errors for the tab |
⌘J hides or shows the results.
The status bar
From the left: your Claude and Codex plan limits (hover for when they reset), caffeine (keeps the Mac awake), the project folder, the git branch (click to switch) and the size of your uncommitted changes. On the right: the lint count, and either the size and time of the last result, or, when you select cells in the result, their sum, average and count. Click a number to copy it; right-click for more measures, such as median, min and max.
Everything else
- Command palette — press ⇧ twice. ⌘P searches files, ⌘⇧P actions, ⌘⇧B tables, ⌘⇧F text.
- Usage dashboard — ⌘⇧I shows your queries and your agents' over time.
- Keyboard shortcuts — ⌘? lists them all.